- Home
- IR Information
- Consolidated Financial Highlights
Consolidated Financial Highlights

| IFRS | |||||
|---|---|---|---|---|---|
|
3/2022 |
3/2023 |
3/2024 |
3/2025 |
3/2026 |
|
|
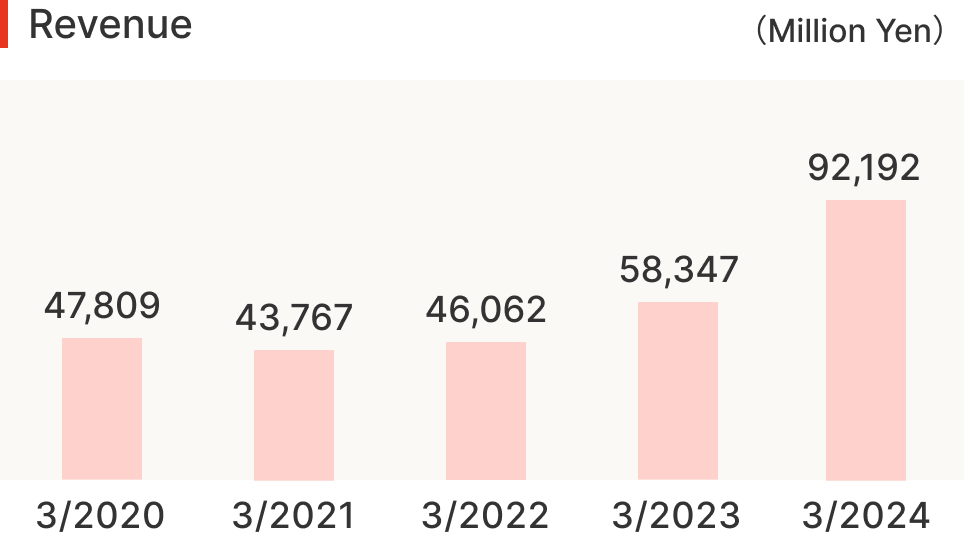
Revenue (Million Yen) |
46,062 | 58,347 | 92,192 | 97,069 | 112,904 |
|
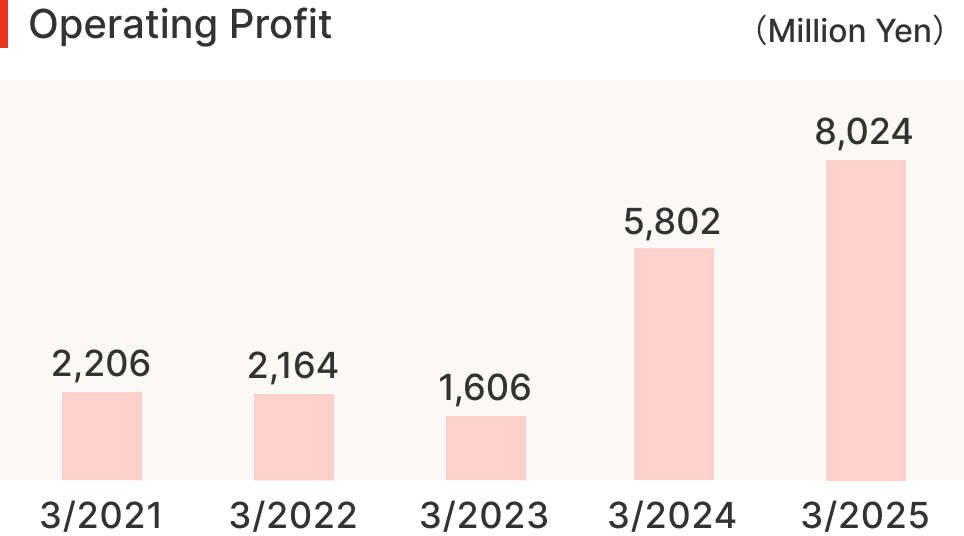
Operating Profit (Million Yen) |
2,164 | 1,606 | 5,802 | 8,206 | 10,324 |
|
Ratio of Operating Profit to |
4.7 | 2.8 | 6.3 | 8.5 | 9.1 |
|
Profit Attributable |
1,715 | 1,062 | 5,524 | 5,746 | 6,472 |
|
Equity Attributable to |
3.5 | 1.8 | 7.9 | 8.0 | 8.6 |
|
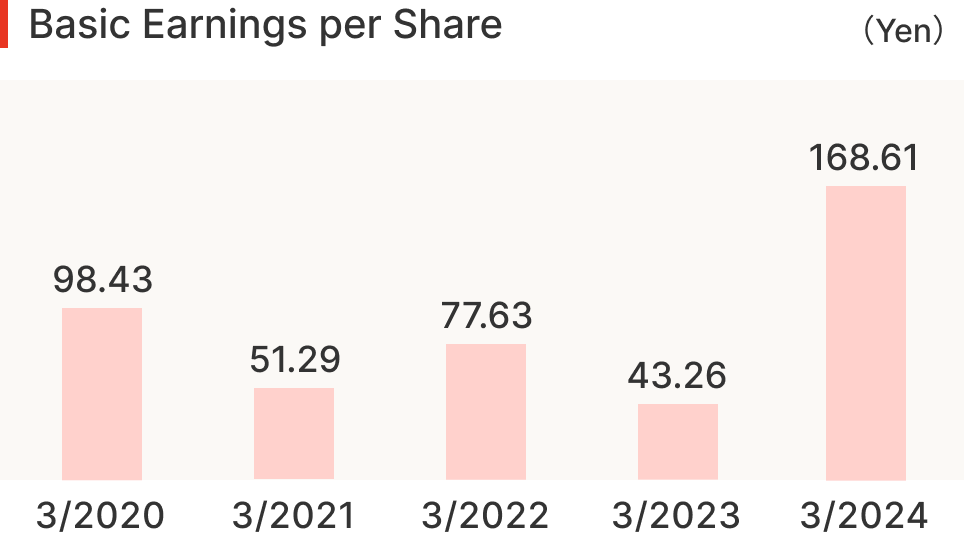
Basic Earnings per Share (Yen) |
77.63 | 43.26 | 168.61 | 175.61 | 197.88 |
|
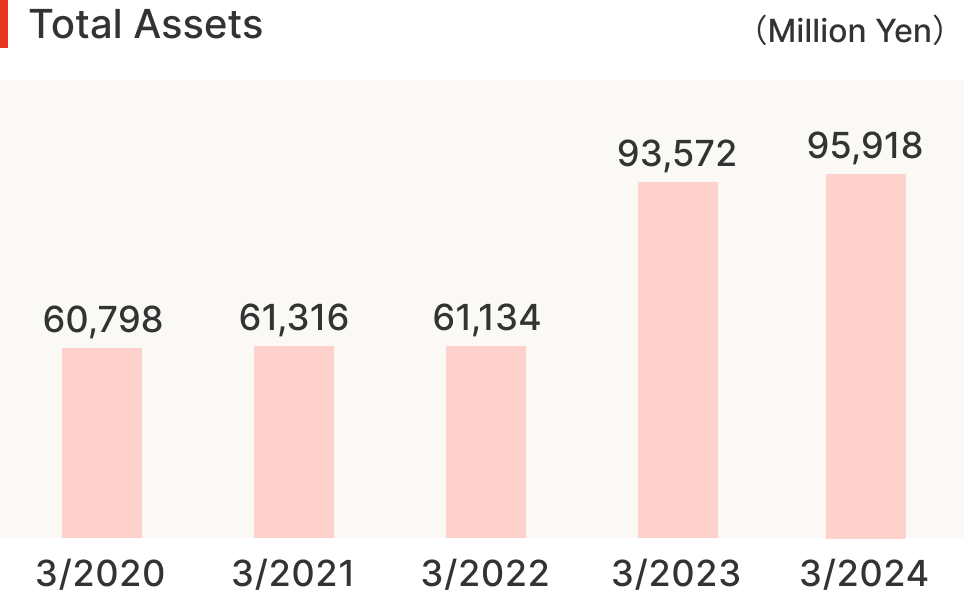
Total Assets (Million Yen) |
61,134 | 93,572 | 95,918 | 110,585 | 105,827 |
|
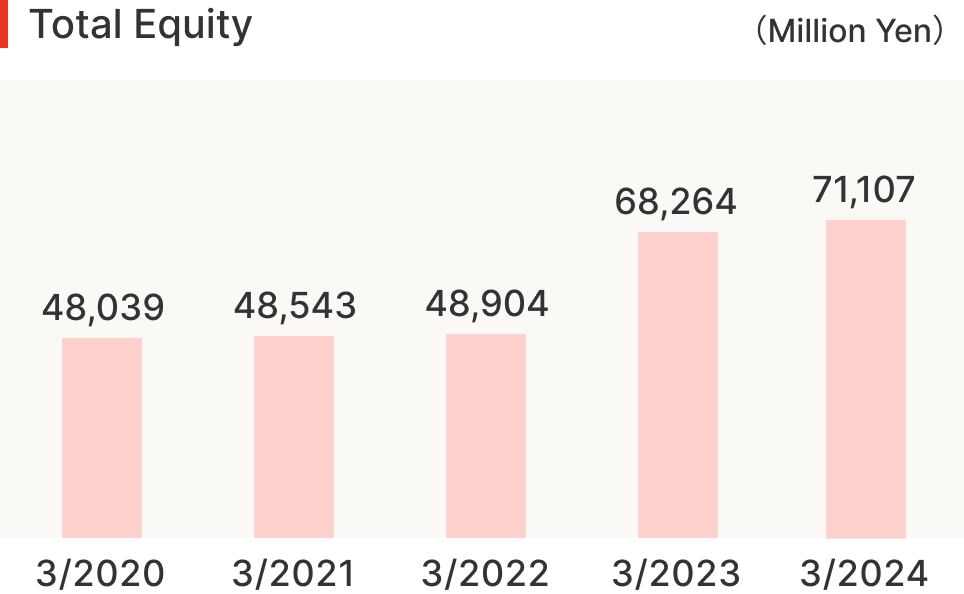
Total Equity (Million Yen) |
48,904 | 68,264 | 71,107 | 74,586 | 77,197 |
|
Ratio of Equity Attributable to |
80.0 | 73.0 | 74.1 | 66.1 | 72.9 |
|
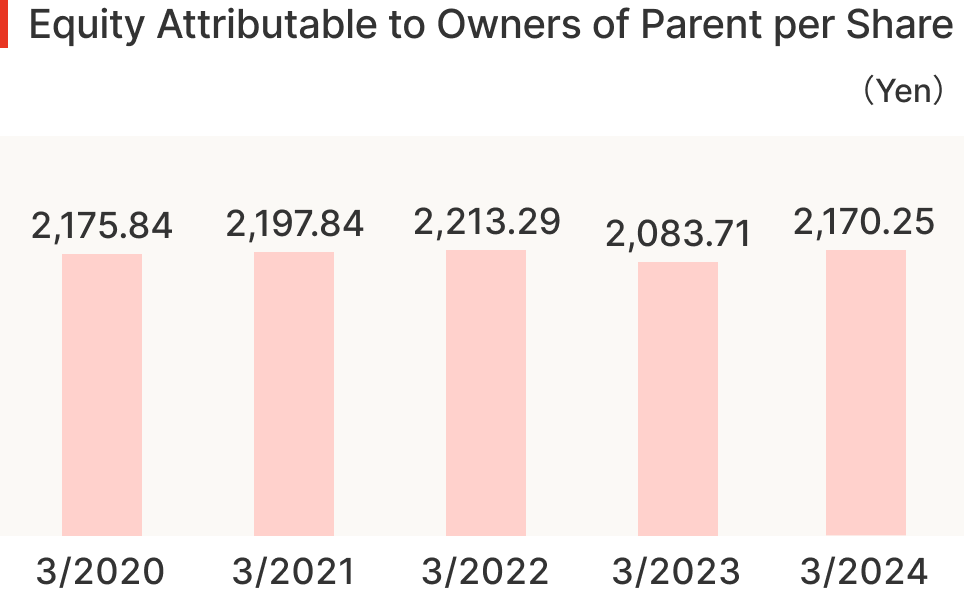
Equity Attributable to Owners of |
2,213.29 | 2,083.71 | 2,170.25 | 2,247.83 | 2,357.99 |
|
Cash Flows from Operating |
2,178 | (1,625) | 6,662 | 8,927 | 10,764 |
|
Cash Flows from Investing |
(651) | 4,609 | (822) | (8,977) | (4,707) |
|
Cash Flows from Financing |
(2,402) | (3,684) | (4,593) | 2,986 | (11,039) |
|
Cash and Cash |
7,649 | 11,263 | 12,509 | 15,445 | 10,461 |